
Market power
The indicator measures how strong the current move is compared to the daily average of the past X days.
"Keep the current move's power in sight at all times."
The indicator measures how strong the current move is compared to the daily average of the past X days.
Shows rising or falling momentum across the last X bars.
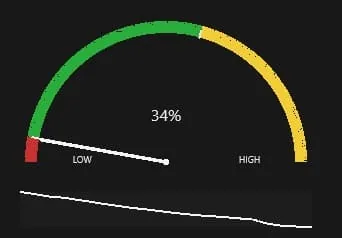
Define custom low/medium/high zones for each instrument.
Every setting is customizable in both size and behavior.
Two moves can look identical on a chart – the same candle size, the same distance – yet one is backed by real volume and volatility while the other is already running out of momentum. Without measuring that, it's easy to chase a move that's already exhausted or ignore a real trend because it doesn't look impressive yet.
Price shows the move. Strength tells you how much conviction is behind it.
Not just PowerMeter: all my other tools are included, Account Guard and the Trading Journal among them.
If PowerMeter keeps you out of a single exhausted move in those 14 days, it has paid for itself for the rest of the year.
No credit card required · No automatic charges