A NinjaTrader 8 indicator for the Opening Range and Initial Balance, with Asia session, London session, and previous day levels on the same chart - so you can trade Opening Range Breakouts with the full picture in view.
Two lines mark the range. They don't tell you if the breakout is real.
Anyone can draw the Initial Balance high and low. What those two lines don't tell you is whether real volume is supporting the breakout, or whether price is running straight into the Asia range, the London range, or yesterday's high or low – the context that often turns a clean-looking breakout into a fakeout.
The breakout always looks the same. What happens next depends on what's around it.
See the Opening Range and Initial Balance in Seconds
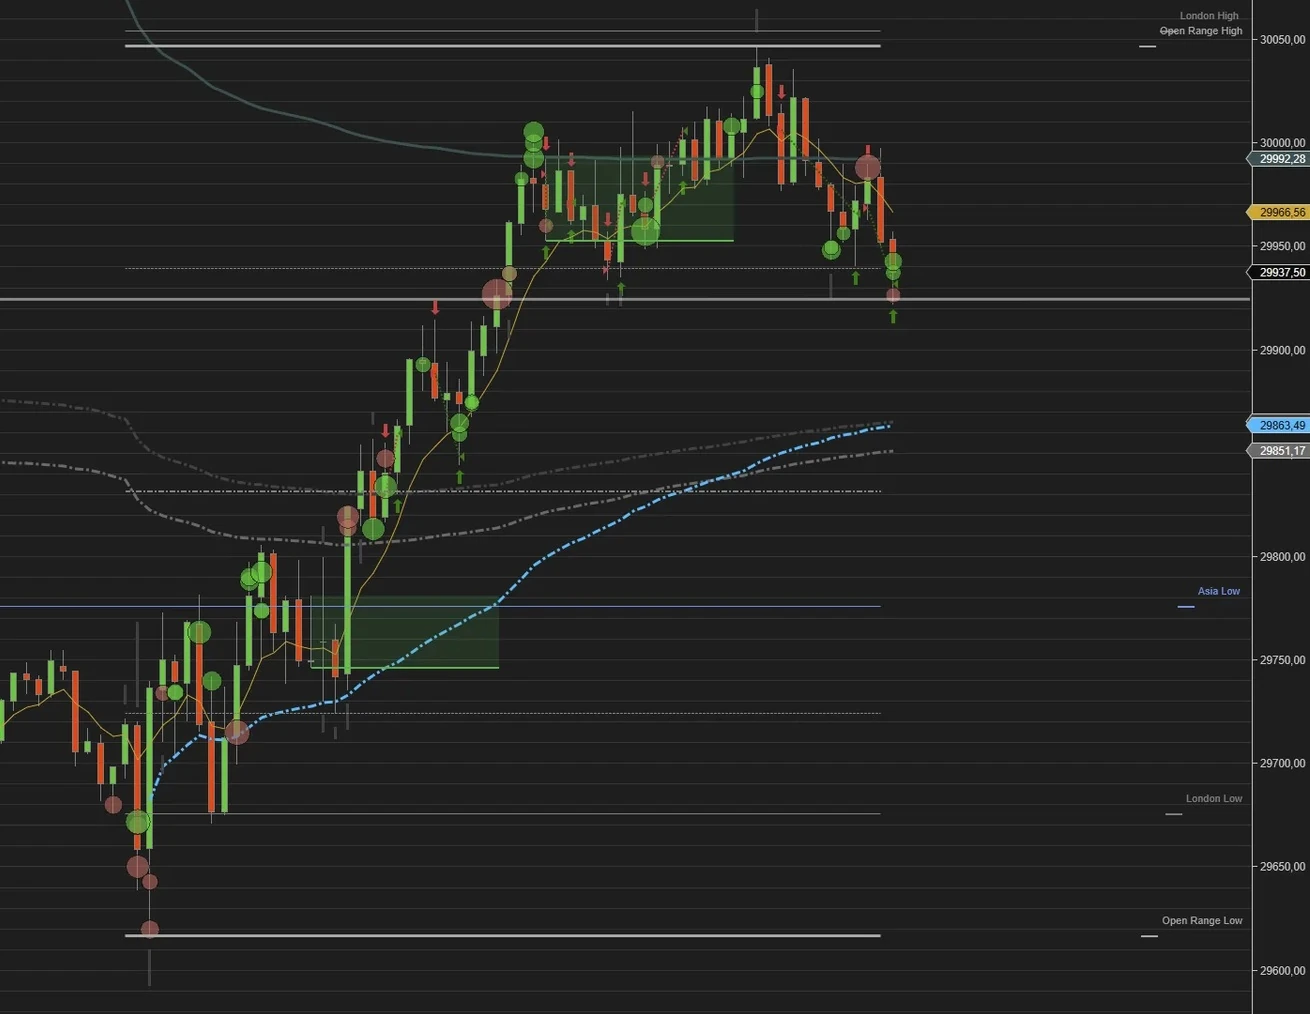
Arty's Opening Range Indicator plots the session's opening range directly on your chart. You set the start and end time, and the indicator draws the Initial Balance high, low, midpoint, and optional quarter levels automatically - giving you a clear map of the day right from the first few minutes.
If you trade an Opening Range Breakout or an Initial Balance breakout, you'll see at a glance whether price is holding inside the range, rejecting a level, or accepting above or below it. Your chart stays structured, without extra noise.
Main chart view with Opening Range, midpoint, and quarter levels.
Add Asia Session and London Session Levels
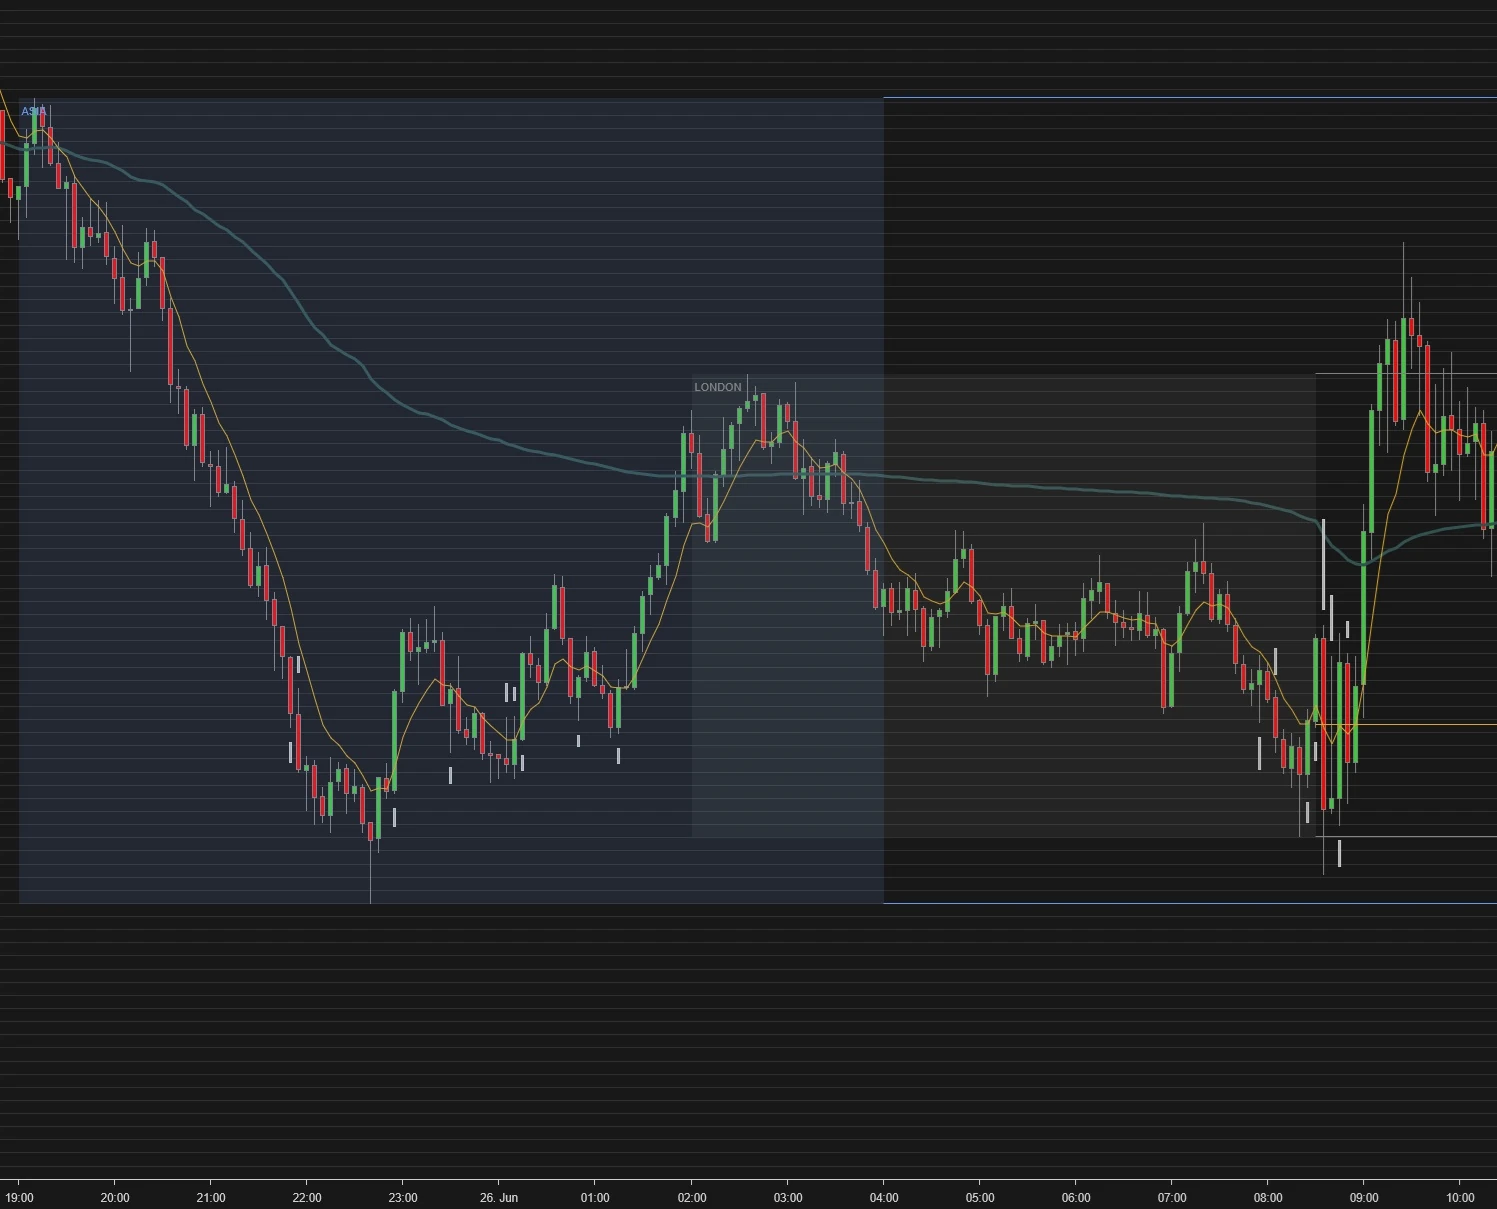
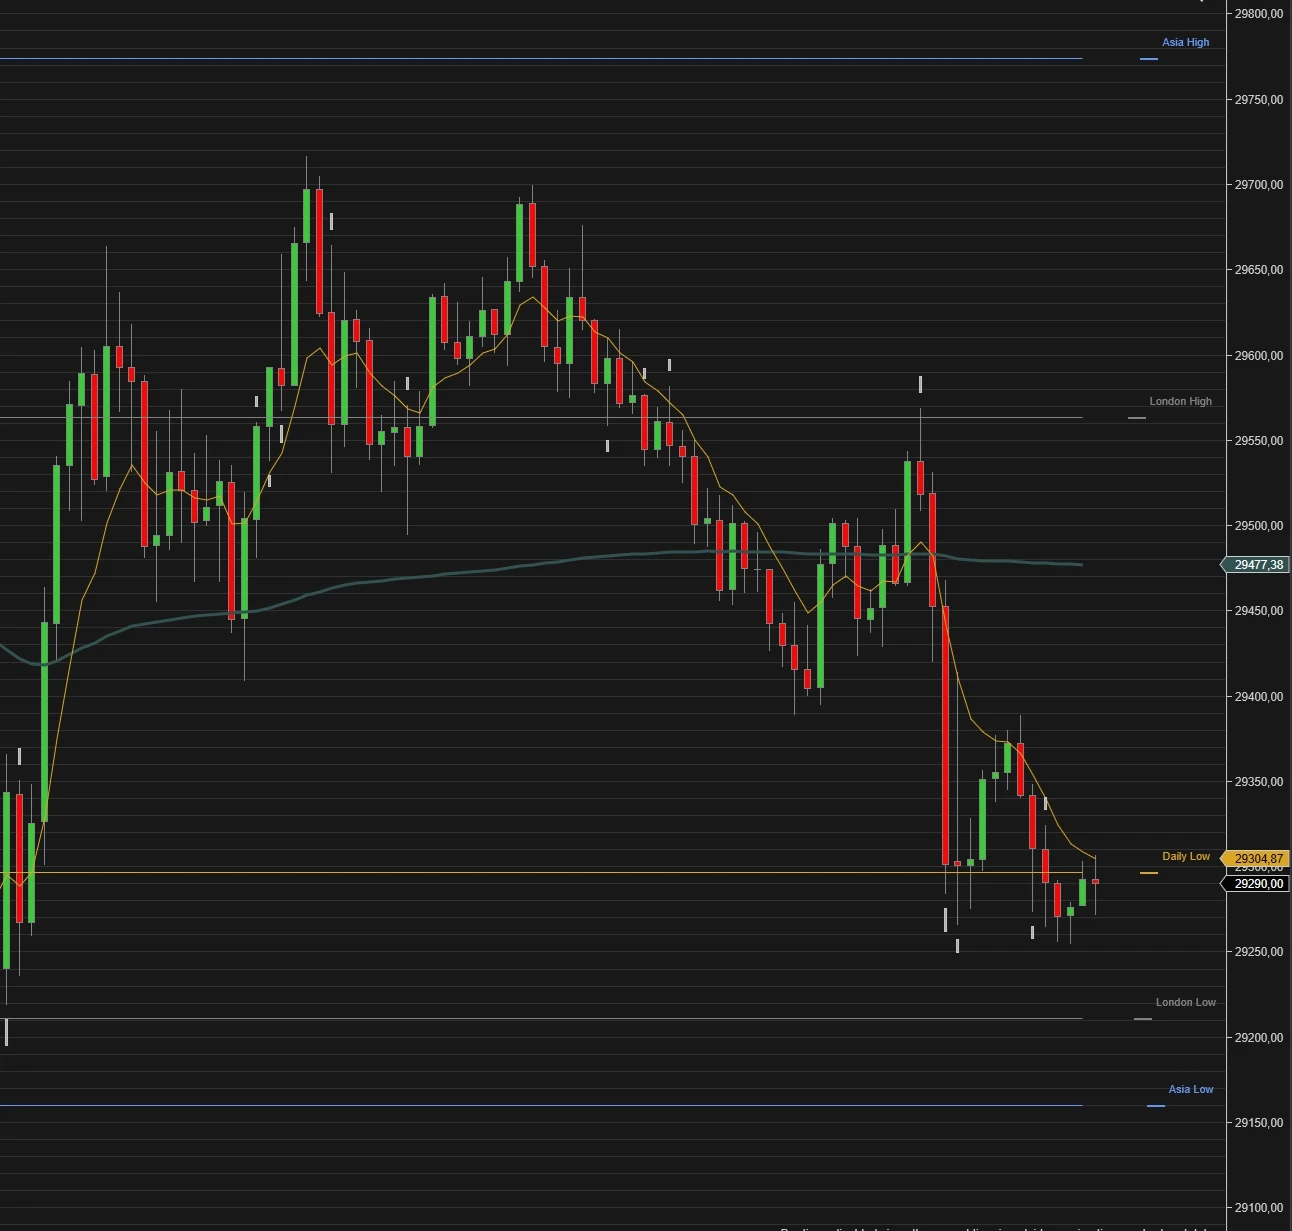
The indicator can also plot Asia session levels, London session levels, and the previous day's high and low. That gives you more context when an opening range forms near an older high, a session low, or another level the market is already watching.
Transparent session boxes make it easy to see where the Asia and London ranges started and ended. Instead of switching between tools, you get one view for opening range, support and resistance, and breakout context.
Opening Range shown together with Asia, London, and previous day levels.
Volume Confirmation at the Levels That Matter
Arty's Opening Range Indicator can mark volume when price trades near an important level and volume runs stronger than the recent average. That helps you spot when an opening range high, opening range low, Asia level, London level, or previous day level is attracting real activity.
You can adjust the lookback, distance in ticks, marker size, sensitivity, and color - so the chart stays readable while still giving you a simple confirmation layer when the market gets active around a key level.
Volume markers, styling, and session box options.
One Indicator for Structure, Context, and Confirmation
If you want a NinjaTrader 8 Opening Range Indicator that stays easy to read, this tool brings the important pieces together: Initial Balance levels, Opening Range Breakout structure, optional Asia and London levels, previous day highs and lows, and volume confirmation at the prices that matter most.
Instead of guessing where the market is reacting, you get a clear daily map with visible breakout areas, return-to-level setups, and session context in one place - so you can stay organized, trade with more confidence, and prepare faster for the open.
Summary view of the Opening Range Indicator's main benefits.
Flexible Session Times for Your Own Setup
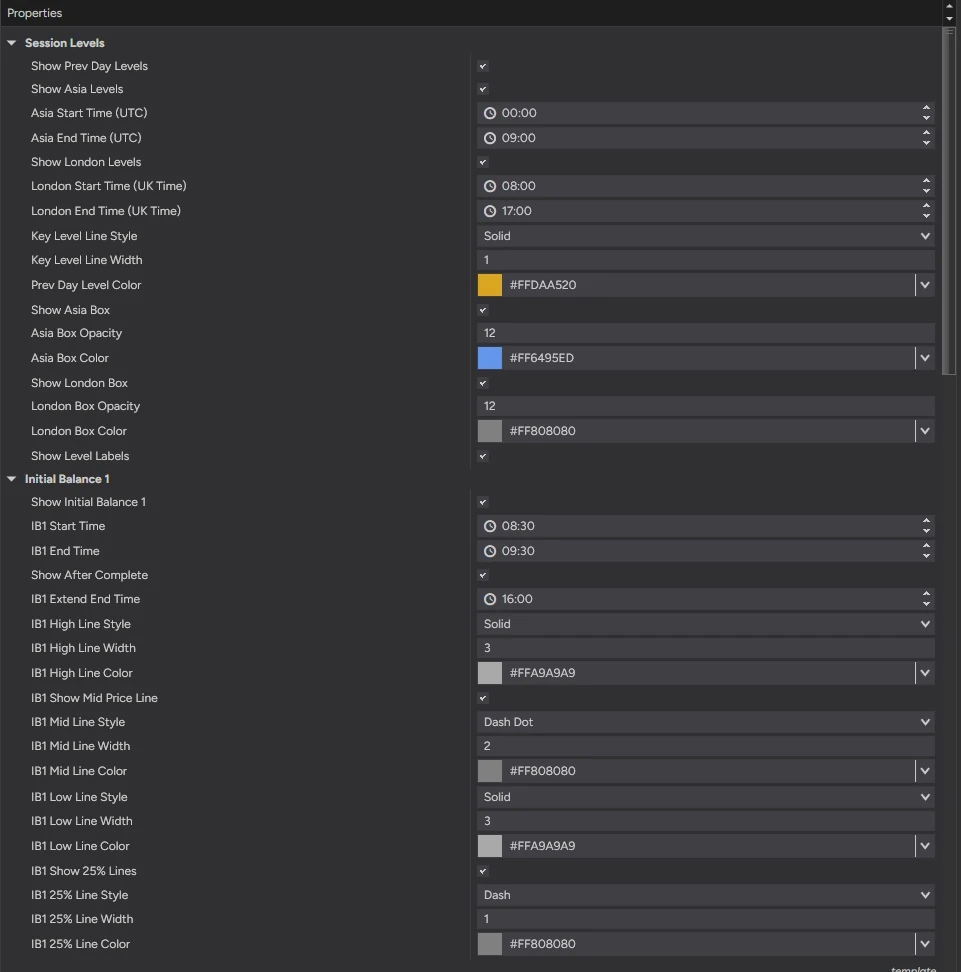
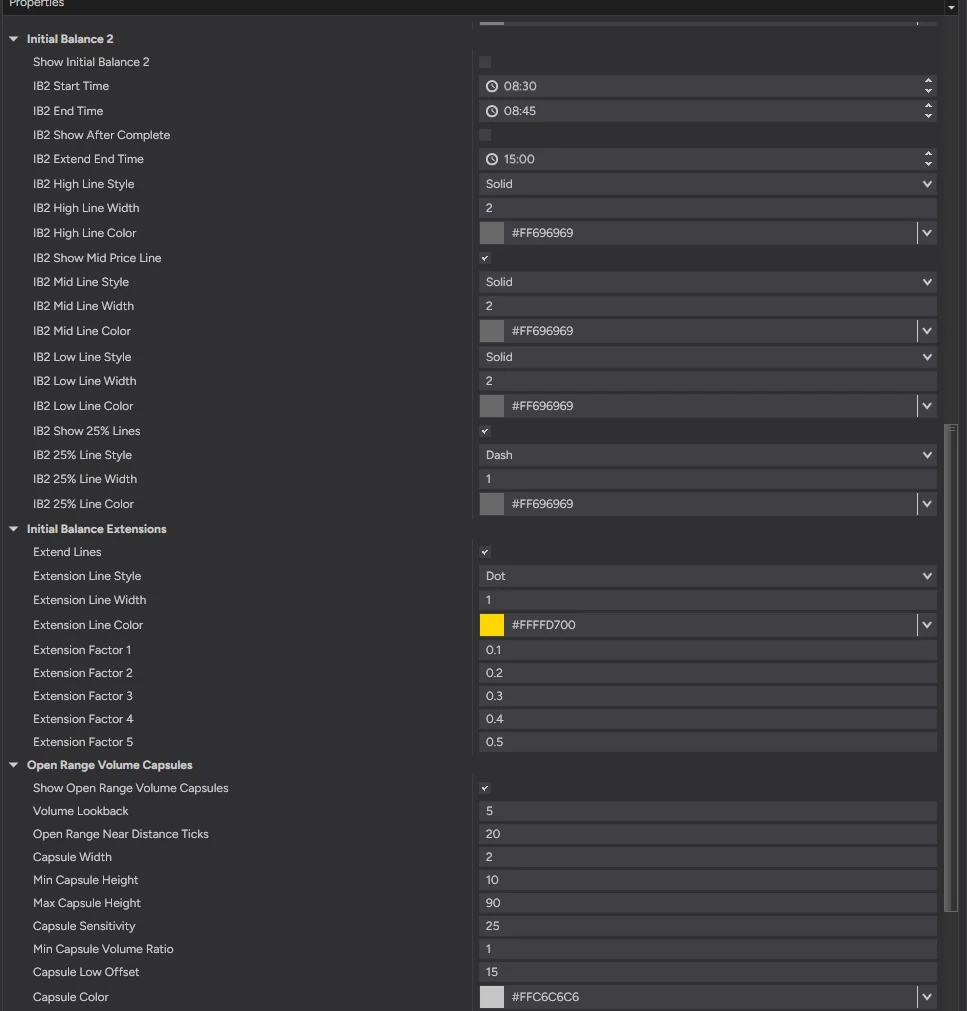
In the settings, you choose exactly when your main opening range starts and ends. You can also enable a second Initial Balance window later in the session, if you want a second reference range once the opening move has played out.
Optional quarter lines, midpoint lines, breakout extensions, line labels, and extended range visibility let you shape the indicator around your own market and timeframe - useful for fast opening setups as well as slower intraday structure trading.
Settings view with Opening Range times, Initial Balance options, and extension controls.
Everything the Opening Range should show you
Full opening structureOpening Range, range Extensions, midpoint, and quarter levels, drawn automatically.
Session context in one viewAdditional Asia and London session high/low, and previous day highs and lows.
Volume at the levels that matterPills mark where real activity shows up at IB or session levels.
Built for your own setupAdjustable times, a second OR session, and full control over what's shown.
Try everything free for 14 days
Not just the Opening Range Indicator: all my other tools are included, Account Guard and the Trading Journal among them.
If it shows you one level on a single morning that you would have otherwise missed, it has paid for itself.