Master the order flow by identifying institutional block trades and significant volume clusters in real-time on NinjaTrader 8.
Your chart shows you price. It doesn't show you who's actually trading it.
Large buy and sell orders happen at specific prices, not just at specific points in time. A standard volume bar at the bottom of your chart tells you that a lot of volume was traded – but not where, and not whether it came from aggressive buyers or aggressive sellers at that price.
Volume without a price is just a number. Volume at a price is a decision.
All volume block trades at a glance
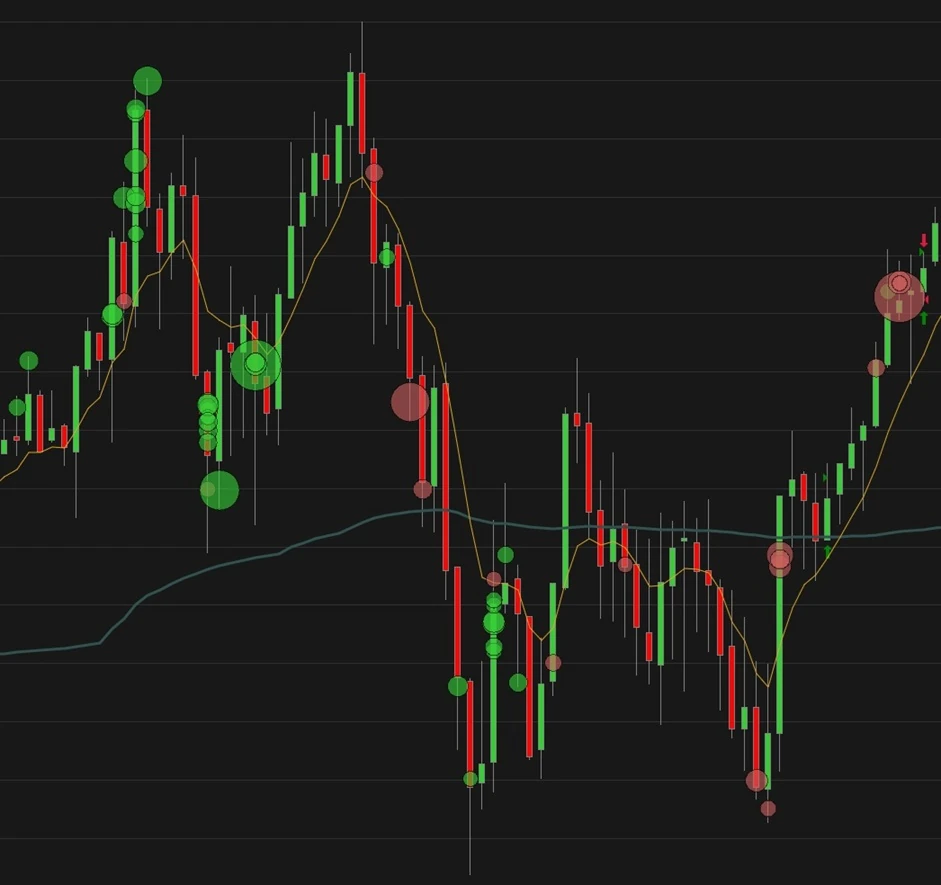
The Block Trades Indicator for NinjaTrader displays large block and cluster trades as a volume overlay right on your chart at the exact price where the block printed. Green highlights strong buying, red highlights heavy selling. Bubble size scales with the block volume so you instantly see where institutional orders and volume clusters are stepping in. Works even with the free version of NinjaTrader.
Sizes, colors, and settings are fully customizable.
Bar view for higher timeframes
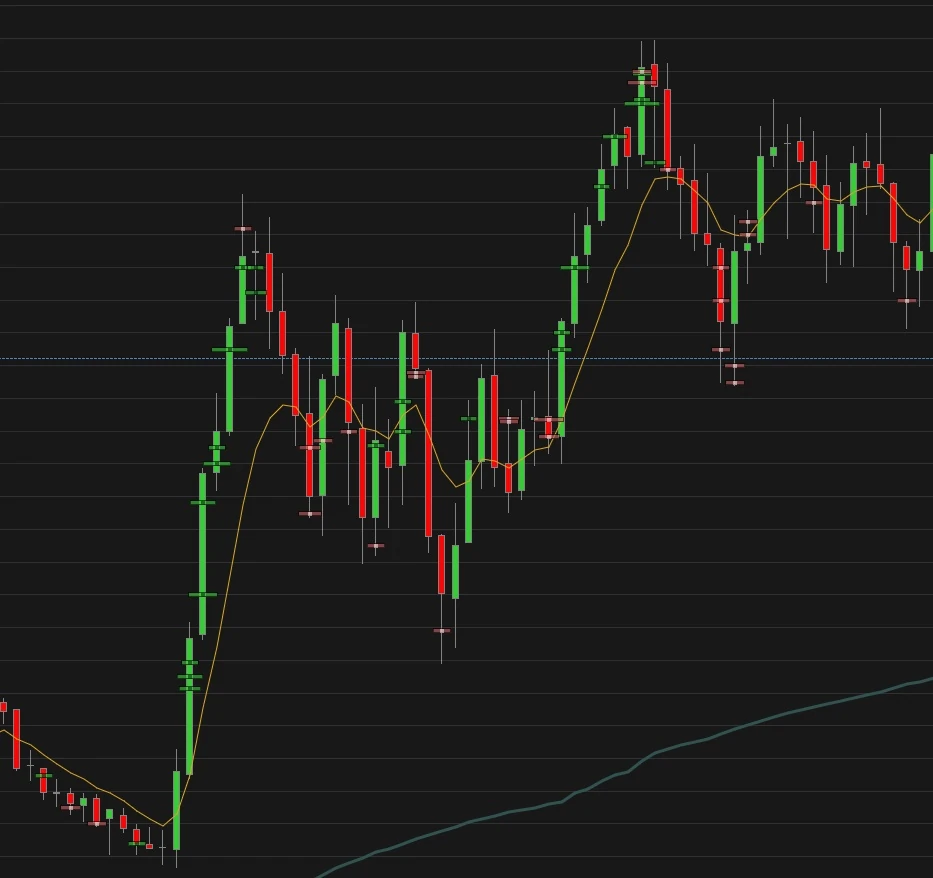
On higher timeframes (e.g. 1H or 4H) the bar view bundles block and cluster trades so you can spot dominant volume clusters, shifts in order flow, and volume spikes fast. That way you quickly see who is driving the market.
Hover a bar or bubble to see block size and additional data instantly.
Easy to configure – every vital parameter in one place
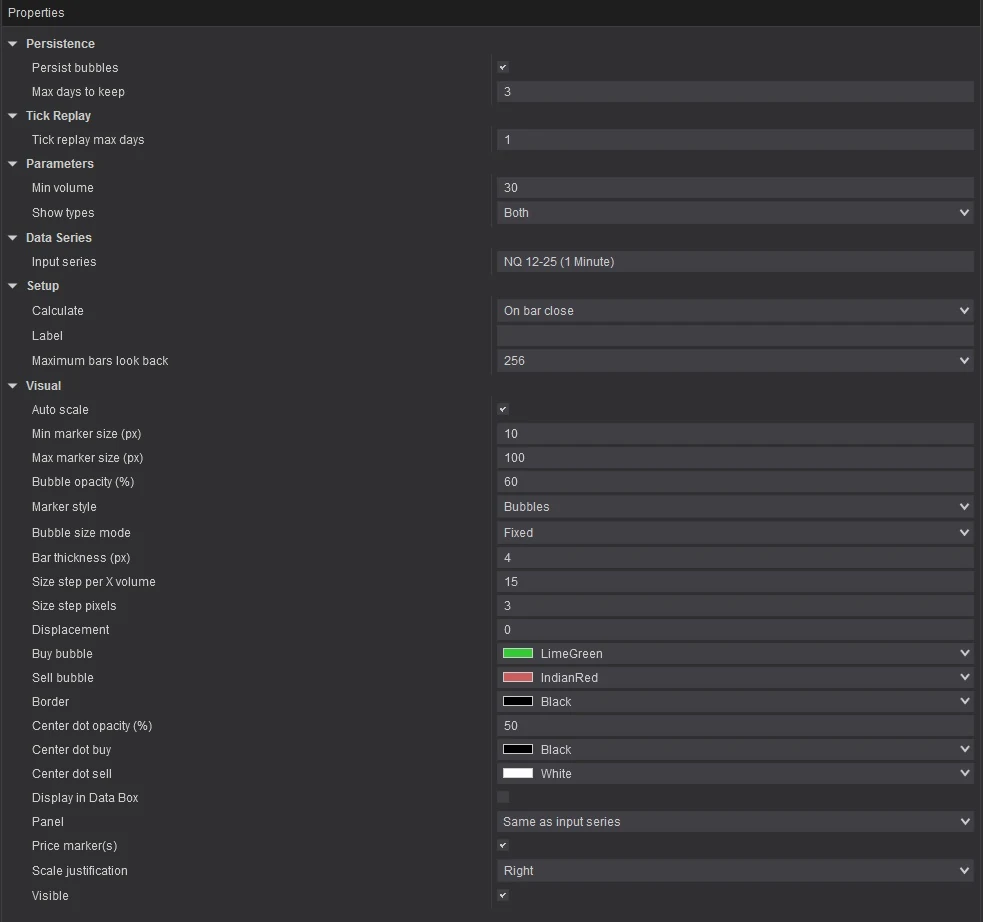
Customize the indicator for your volume setup: set the minimum block size, choose blocks, cluster trades or both, decide if bubbles persist, and pick dynamic sizing (largest block trade of the day) or fixed tiers—so it fits your orderflow/volume-profile workflow.
If you have any questions, I’m happy to help via Contact
Your Order Flow Advantage
Block trades on your chartEvery large block or cluster trade appears as a bubble right at the price it printed, colored by buying or selling pressure.
Volume clusters, not noiseBubble size scales with block volume, so dominant clusters stand out instead of blending into the chart.
Built-in bar viewOn higher timeframes, prints are bundled into bars so shifts in order flow are visible at a glance.
Works with the free NinjaTrader licenseNo NinjaTrader OrderFlow Package needed to see block and cluster trades on your chart.
Try everything free for 14 days
Not just the Block Trades Indicator: all my other tools are included, Account Guard and the Trading Journal among them.
If it helps you make one better decision today, it has paid for itself for the rest of the year.